HTTP Debugger Pro
12.4 MBVersion
10.3
Description
HTTP Debugger Pro Overview
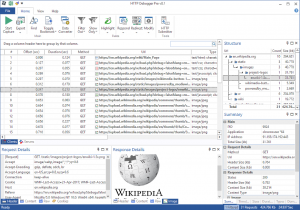
Capture, view and analyze all outgoing and incoming traffic between a web browser or program that uses HTTP protocol, and the Internet. Each HTTP request and/or response can be examined to see the HTTP header parameter values, cookies, query strings, the source code of HTML/XML web pages and Java/VB scripts, error codes etc. All captured web pages and images can be viewed in the built-in web browser control. All captured HTTP traffic can be exported into the log files either in the RAW network or in the decoded (how browsers see it) format. SoftX HTTP Debugger works with all popular web browsers (Internet Explorer, Mozilla FireFox, Opera, etc) and their plugins. Software developers can use it to view and analyze the HTTP traffic of their own software programs.
Features of HTTP Debugger Pro
- Full support of both 32-Bit and 64-Bit applications.
- Decoding of HTTPS/SSL connections and gzip/chunked content.
- Support of Dial-up modem, DSL/ISDN/Cable/LAN connections.
- Support of Internet Explorer, Mozilla Firefox, Opera and Google Chrome.
System Requirements for HTTP Debugger Pr
RAM: 2 GB
Operating System: Windows 7, 8, 8.1, 10 and 11
Space Required: 50 MB
What's new
Images